

Supertrend is on more charts than almost any other trend tool. A line sits under price when the trend is up and over it when the trend is down, and the flip from one side to the other is the signal. On a screenshot of a trend day it looks like it called the whole move. So people automate it. Buy the flip up, sell the flip down, let the code do the rest.
Start with what the line is. It trails price by three times the average true range and only ratchets in the direction of the trend. It flips when price closes through it. That means every flip arrives after price has already travelled about three ATR off the extreme. The line is built entirely from bars that have already closed. It is a record of where price has been, not where it's going.
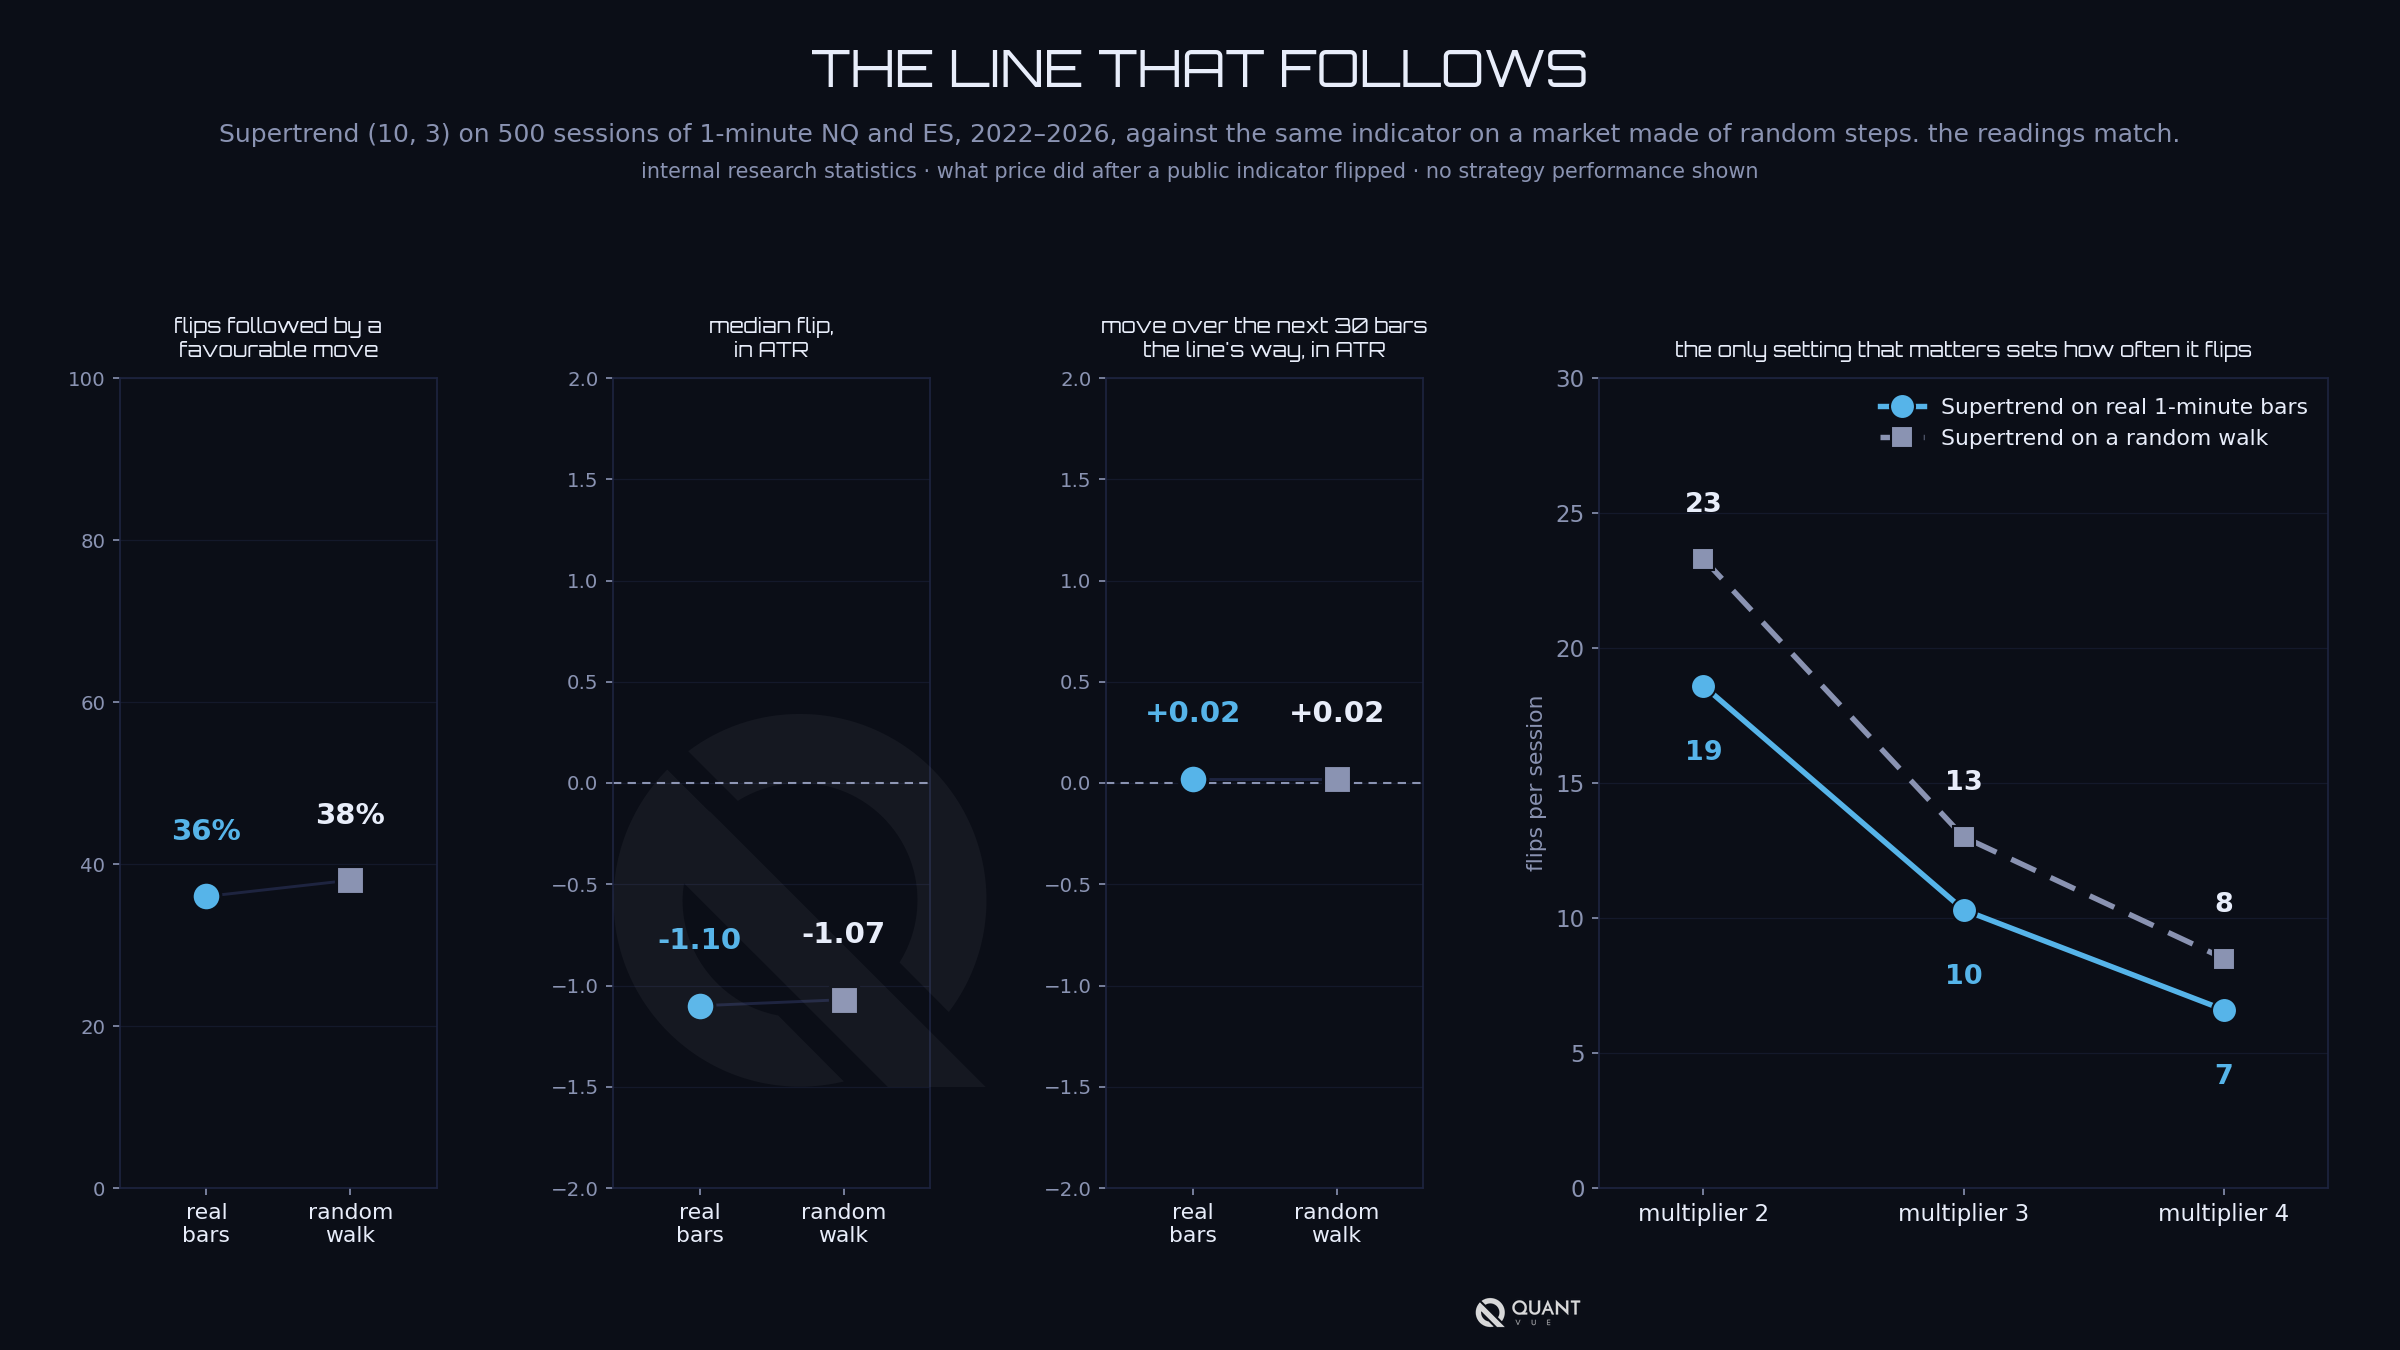
A record can still carry information, so I tested it. Default settings, length 10 and multiplier 3, on 1-minute NQ and ES across 500 randomly drawn sessions from 2022 to 2026. Then the control from #34. I built a fake market, a random walk where each bar is a random step with no trend, no memory and nothing to predict, and ran the same indicator over 300 sessions of it. If Supertrend reads something in real price, the real numbers should beat the random ones.
They don't. On real bars, 36 percent of flips were followed by a move in the flip's direction before the next flip. On the random walk, 38 percent. The median flip ended 1.1 ATR on the wrong side in both. Thirty bars after any given moment, price had moved 0.02 ATR in the direction the line was pointing, on real data and on the random walk alike. The one place the market differed is that real bars flipped a little less often, about 10 times a session against 13, but that was inconsequential.
Messing with the settings didn't help either. Length 7, 10, 14 or 20 gives the same flip count and the same result. The multiplier does change things, and what it changes is how often the line flips. At 2 it flips about 19 times a session, at 4 about 7. The random walk shows the same dial with the same shape. #32 covered what the optimize button returns when the rule underneath has no edge, and this is a clean case of it. You are tuning how often you trade a coin flip.
One more thing from the study, because it's how people get fooled. The first look was 20 sessions on the chart. The ten NQ sessions looked like a working trend follower. The ten ES sessions looked like a loser. On 250 more sessions each, both went to zero. A careful chart review of ten sessions would have produced a confident, wrong answer. The higher timeframes were no kinder. On 5-minute bars the line's side at the open matched the day's direction 51 percent of the time, and on daily bars it said nothing about the next day.
Supertrend is the one I ran, but look at why it failed and compare that to other popular indicators. A moving average cross, MACD, Parabolic SAR, and a Donchian flip are all arithmetic on closes that have already printed, and each one tells the story of the past and not the future. I haven't run every one of them through this test but I'm willing to bet the result is the same. The test is the same for all of them. A discretionary trader gets away with these tools because the trader supplies the context and skips most of the signals. Code takes every flip at face value and pays the spread and commission each time.
None of this makes the line worthless. It's a fair trailing stop for a position you opened for some other reason, as long as you expect to hand back about three ATR at every exit. The entry has to come from somewhere else, and #21 covered where edges that last tend to live. Before you automate any indicator, run it on a random walk first. If its results there look like its results on your market, it has nothing to tell your code.
This lesson was originally sent to the Algo Creator School email list on November 11, 2026. New lessons go out by email regularly. Join the list at quantvue.io.
Educational content only, not financial advice. Futures trading involves substantial risk of loss and is not suitable for all investors. Individual results vary, and past performance, actual or simulated, does not guarantee future results.


After check out, you will receive a Welcome Email with your login details.
Use these details to Login to our dashboard, where you'll then submit your TradingView or NinjaTrader information.
Access is granted automatically if the form is filled out properly.
If you are having issues with access being granted, please submit a support ticket here.
No. Our core system is designed for those with baseline trading knowledge and live-trading experience. Do not sign up if you're a beginner trader. Intermediate to advanced experience is recommended.
No. There is no algorithm or indicator that can accurately predict with 100% certainty the financial markets.
QuantVue is not responsible for trading losses. Past results are never indicative of future performance. Use QuantVue and trade at your own risk.
Our tools are designed for futures. However, clients can tweak our toolkit to any chart or market.
Most clients use a paid TradingView plan, and the most popular among users is TradingView premium.
You can manage your account in the "My Account" tab or submit a support ticket here and we will process your cancellation immediately!
Our monthly & yearly Pro / Elite plans are backed by a 30-day money back guarantee. If you are not 100% satisfied within 30 days from the time of purchase, you may request a full refund.
Beyond the 30-day period, all sales are final.
The 30 day money back guarantee only applies to first time customers. If you have used our system or had a plan in the past, you are not eligble for a refund. This means if you have used the PRO plan in the past and sign up for ELITE at a later date, you will not be elgible for the refund guarantee and vice versa.
This refund policy does not apply to our ATS program.
See our full refund policy here.
There is a separate money back guarantee for the ATS Program. The ATS refund policy has certain conditions that must be met to receive a full refund.
See our full ATS refund policy here.
The Elite Plan on it's own does not automate into cash or prop firm accounts.
If you want to automate our tools into cash or prop accounts, you can do so via our alert connector QuantLynk here.
Keep in mind QuantLynk is detectable by prop firms, so we recommend using an automation-friendly prop firm.
To automate our tools into prop account undetected, we recommend our ATS Program here.
No. There is no free trial on the ATS program.