
The algorithmic edge your buy & hold portfolio is missing
License the same class of automated trading systems institutions have used for decades — disciplined, automated, all-weather strategies that trade any market direction.

“I am blown away by the quality, thoughtfulness, and innovation that continues to come out of QuantVue week after week! Their new ATS 2.0 System is SO user friendly and simply incredible!”
“The value they provide is amazing!!! I have never seen soo many options available for trading systems. On top of that the community and customer service are above and beyond.”
“Quantvue ATS 2.0 is well worth the price. Support by staff is excellent. I am an experienced trader, but new to automated trading. This system makes it so easy.”
“They have an outstanding support team that is knowledgeable, responsive, and always willing to help. In my opinion, QuantVue is the best trading software currently on the market.”
“Quantvue is absolutely incredible! Quantvue is building and innovating faster than I can keep up with sometimes. Quantvue is in a League of Their Own.”
“I have used a number of companies before QuantVue. Their superior technology and amazing customer service from Erik and Jennifer…”
“Quantvue is a genuine and super competent organisation who work hard to make sure the best tools are available to their customers. The community is fun and innovative.”
“I am blown away by the quality, thoughtfulness, and innovation that continues to come out of QuantVue week after week! Their new ATS 2.0 System is SO user friendly and simply incredible!”
“The value they provide is amazing!!! I have never seen soo many options available for trading systems. On top of that the community and customer service are above and beyond.”
“Quantvue ATS 2.0 is well worth the price. Support by staff is excellent. I am an experienced trader, but new to automated trading. This system makes it so easy.”
“They have an outstanding support team that is knowledgeable, responsive, and always willing to help. In my opinion, QuantVue is the best trading software currently on the market.”
“Quantvue is absolutely incredible! Quantvue is building and innovating faster than I can keep up with sometimes. Quantvue is in a League of Their Own.”
“I have used a number of companies before QuantVue. Their superior technology and amazing customer service from Erik and Jennifer…”
“Quantvue is a genuine and super competent organisation who work hard to make sure the best tools are available to their customers. The community is fun and innovative.”
Your portfolio deserves an all-weather approach
Buy-and-hold only pays when the market rises. Algorithmic trading systems take advantage of all market conditions across multiple uncorrelated assets.
Long only, buy & hold portfolio

Algorithmic trading portfolio
Most portfolios only make money in one direction. When the market falls — or just grinds sideways for years — “hold and hope” is the entire strategy
An all-weather, rules-based allocation is built to keep working when the market doesn’t.
Numbers we publish daily, in public
Every automated configuration is tracked daily and published after each month closes, losing months included, with downloadable trade logs for anyone to verify.
Results shared in public every single day
No cherry-picked screenshots, no delayed reporting — every configuration’s results post to the public tracker every trading day, wins and losses alike.
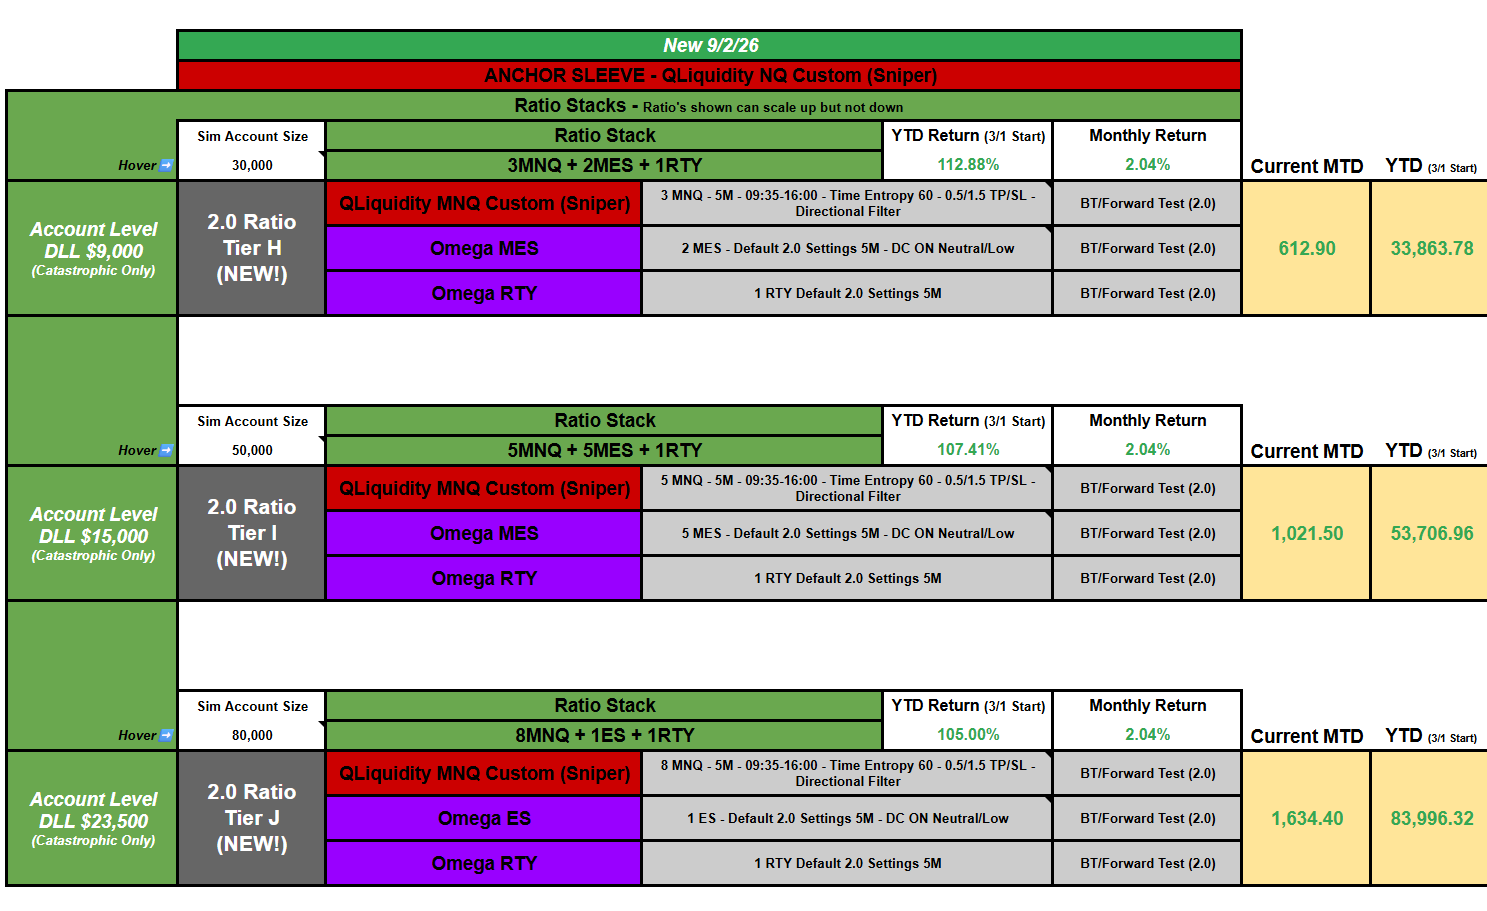
Snapshot of the publicly shared QuantVue forward performance tracking sheet above. Account sizes, settings profiles, and month-to-date and year-to-date figures for every configuration on the sheet.
PAST PERFORMANCE IS NOT NECESSARILY INDICATIVE OF FUTURE RESULTS.
2026 month by month
Completed months only; the current month is published after it closes. Every figure is colored by outcome, blue for profit and orange for loss. January and February are backtest months, tagged in the header. Live forward tracking began March 1, 2026. Losing months stay on the board; that is the point.
All figures are P&L in USD at each configuration's listed contract size, blue for profit and orange for loss. January and February come from the simulated backtest record for every configuration (tagged in the header), as does every month of the three default configurations, which are published on their backtest record. March onward is actual forward trading results for the other eight. A dash means no tracked result for that cell. Row totals sum the months shown. The Master Stack row combines the eight forward tracked configurations; the three default rows are not part of it.
PAST PERFORMANCE IS NOT NECESSARILY INDICATIVE OF FUTURE RESULTS.
Diversified portfolio for U.S. regulated futures & stocks
Long or short, trend or mean reversion: structure-based futures strategies refined over years of live execution, every one tracked daily and published monthly for anyone to audit.

Displayed above are 5 of the 10 QuantVue ATS Program automated strategies
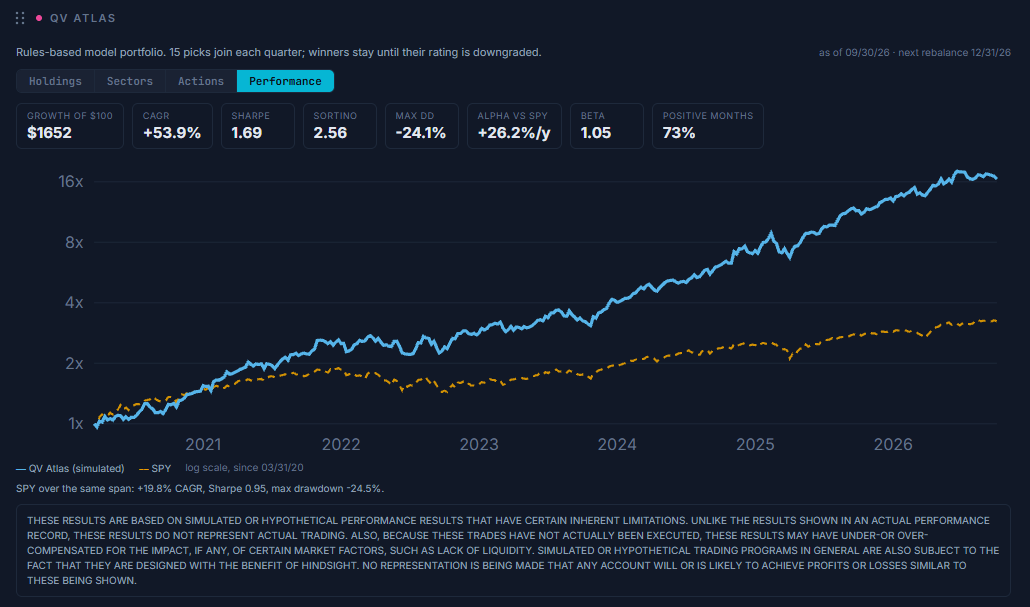
Displayed above is QV Atlas, our quarterly portfolio rebalancing strategy for U.S. stocks
The full ATS 2.0 performance record: profit curves, month by month numbers, an overfitting check, and downloadable daily P&L for every configuration.
“Does this actually work for people?” Watch and decide for yourself
One dashboard, setup 1-on-1 in under an hour
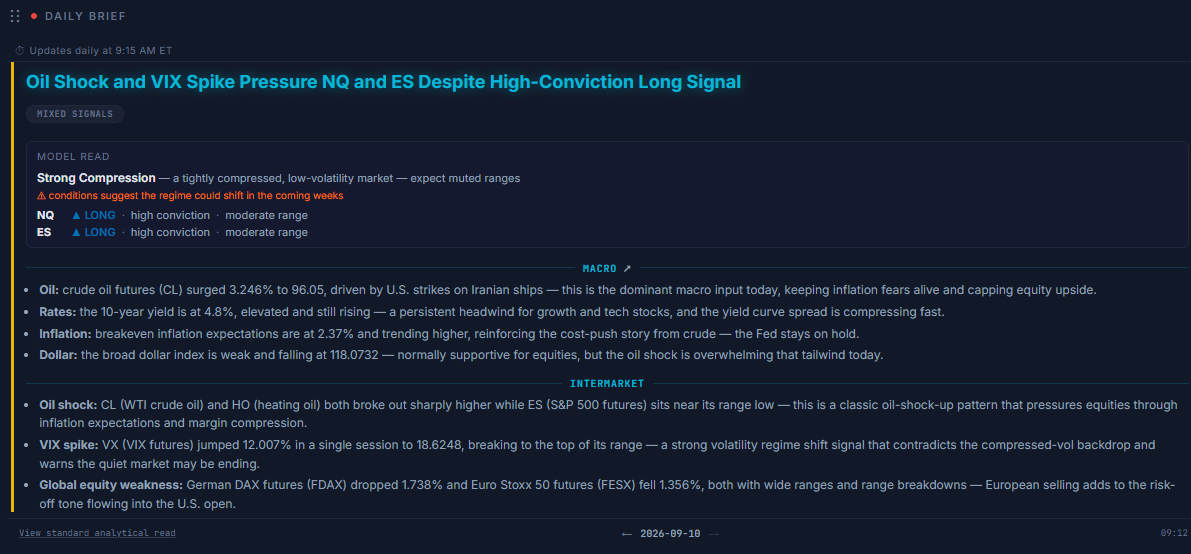
The sophistication of a quant desk with the ease of an app. Deploy strategies in one click, see your daily brief, manage risk automatically — no coding, no screens

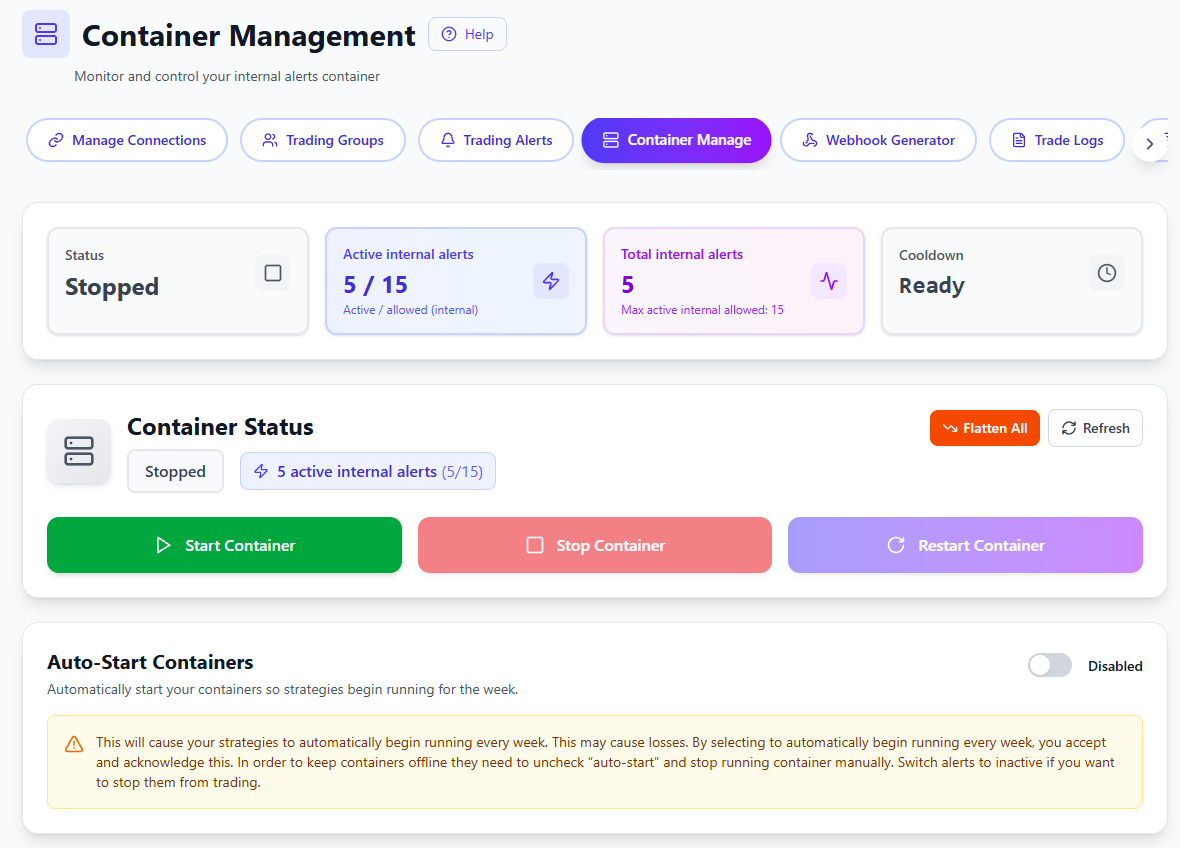
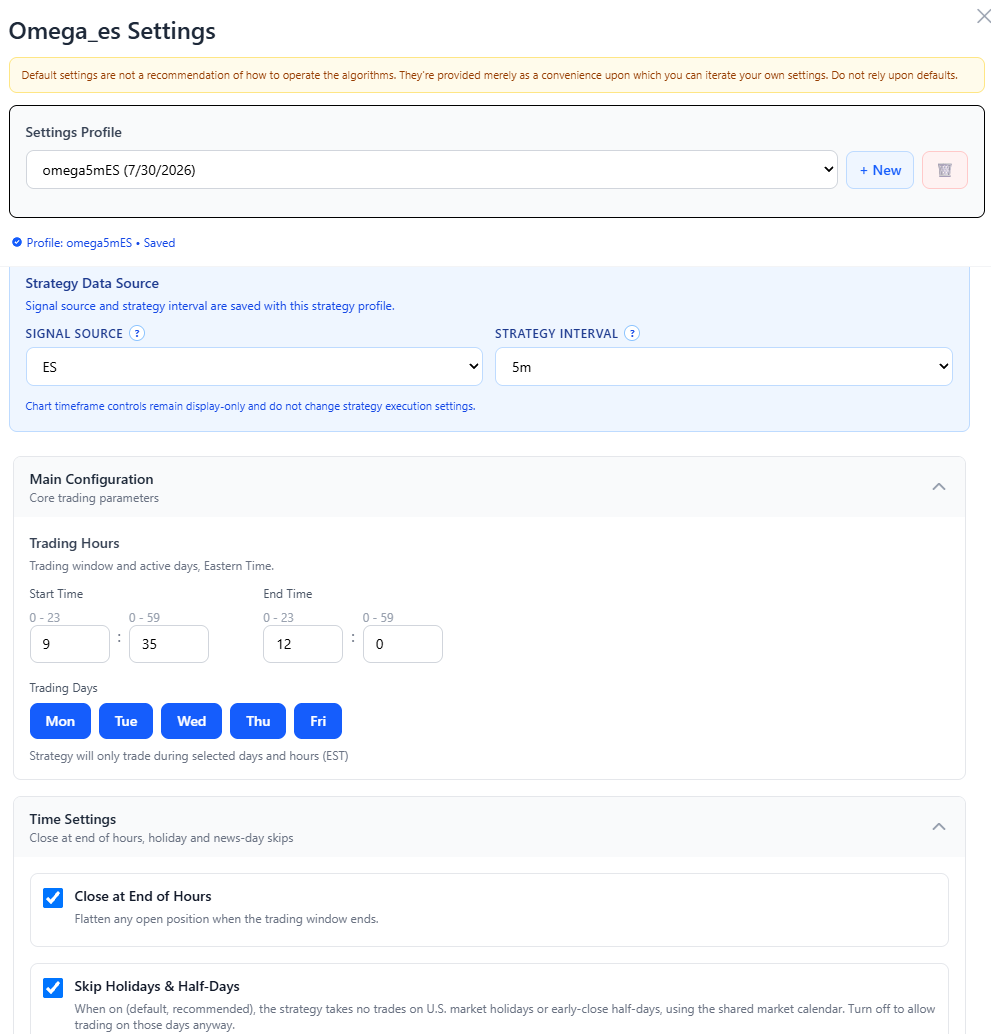
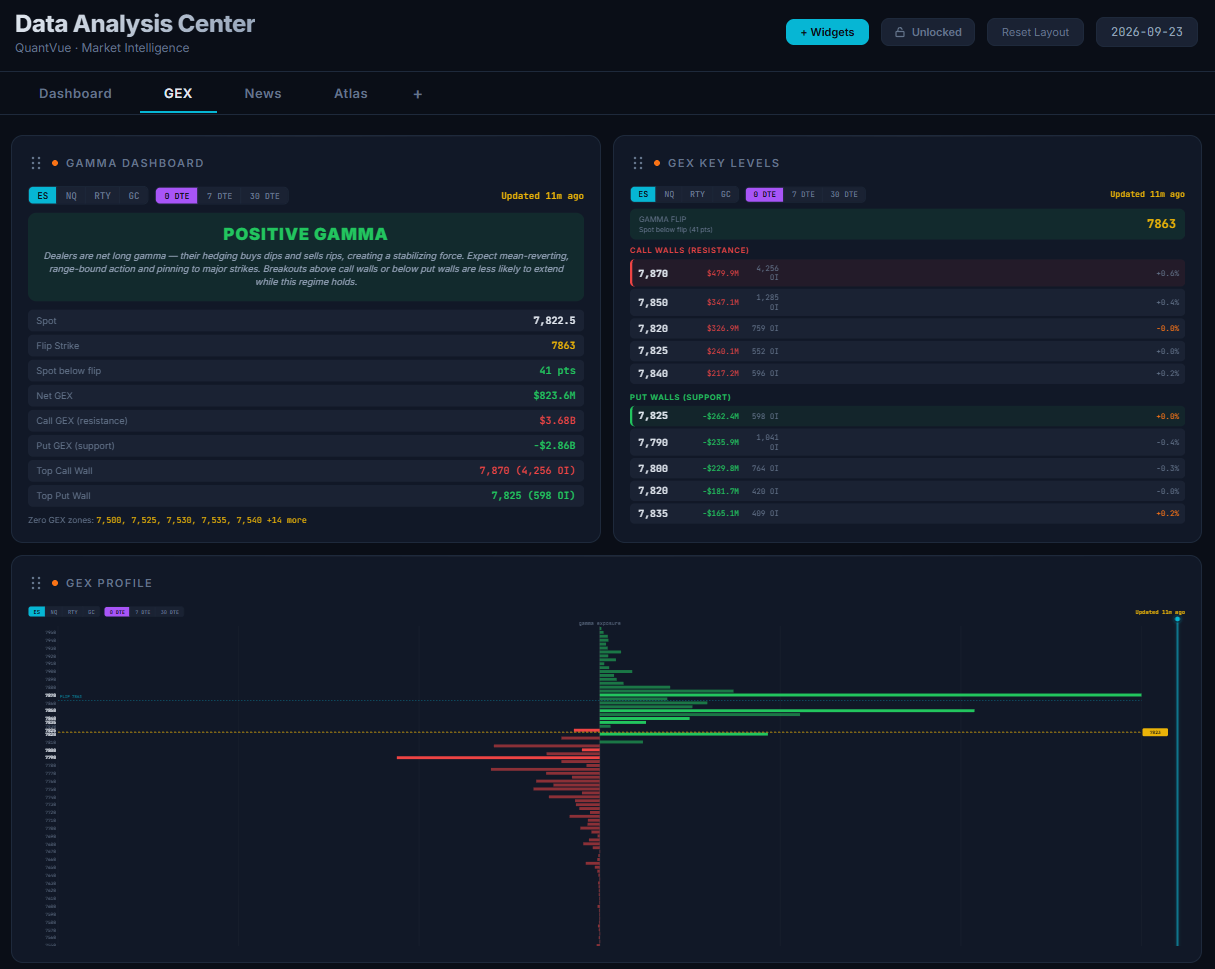
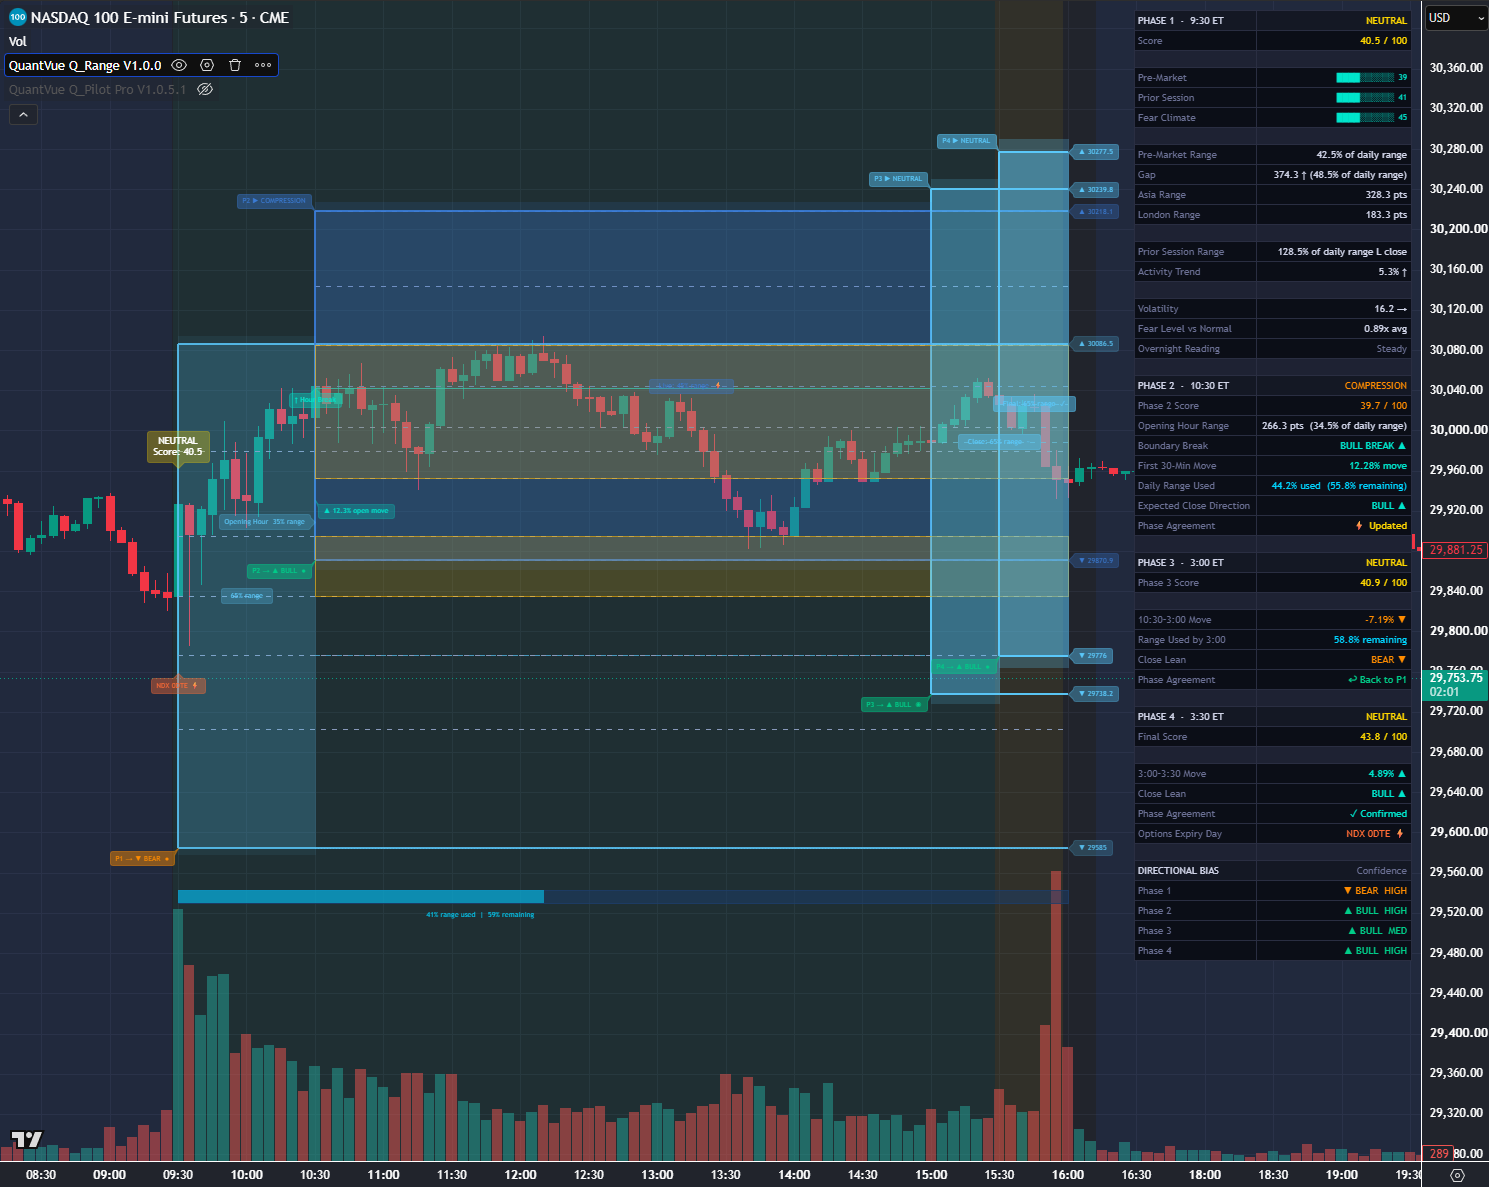
Set up via 1-on-1 white glove onboarding
Live support with a real human who uses the same systems as you, every single day. Not some outsourced call center rep.
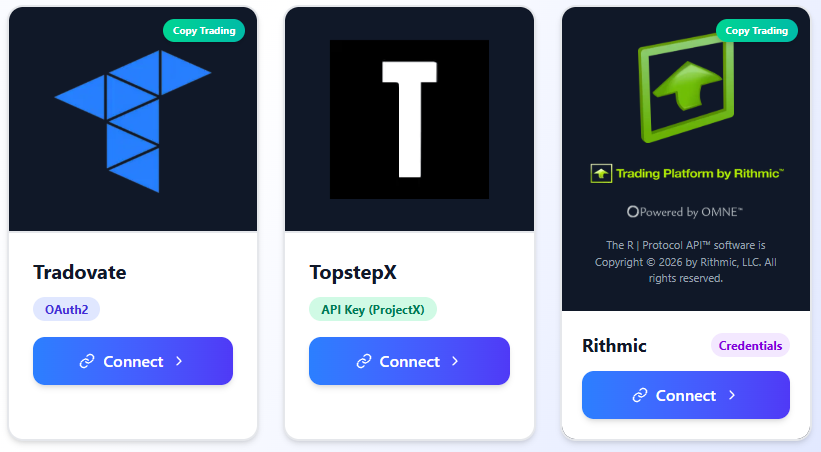
Connect your account
Link your personal cash or prop accounts. The ATS 2.0 broker connections include Tradovate, NinjaTrader, Rithmic, TopstepX
Pick your automated strategies
We walk you through the strategy configurations & best practices, you're always in control of the systems
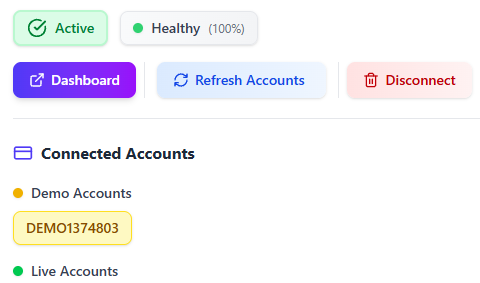
Start automating
The ATS 2.0 system executes and manages trades. See live trades right in the dashboard or at your broker
White-glove onboarding gets your platform connected and your first strategy deployed.


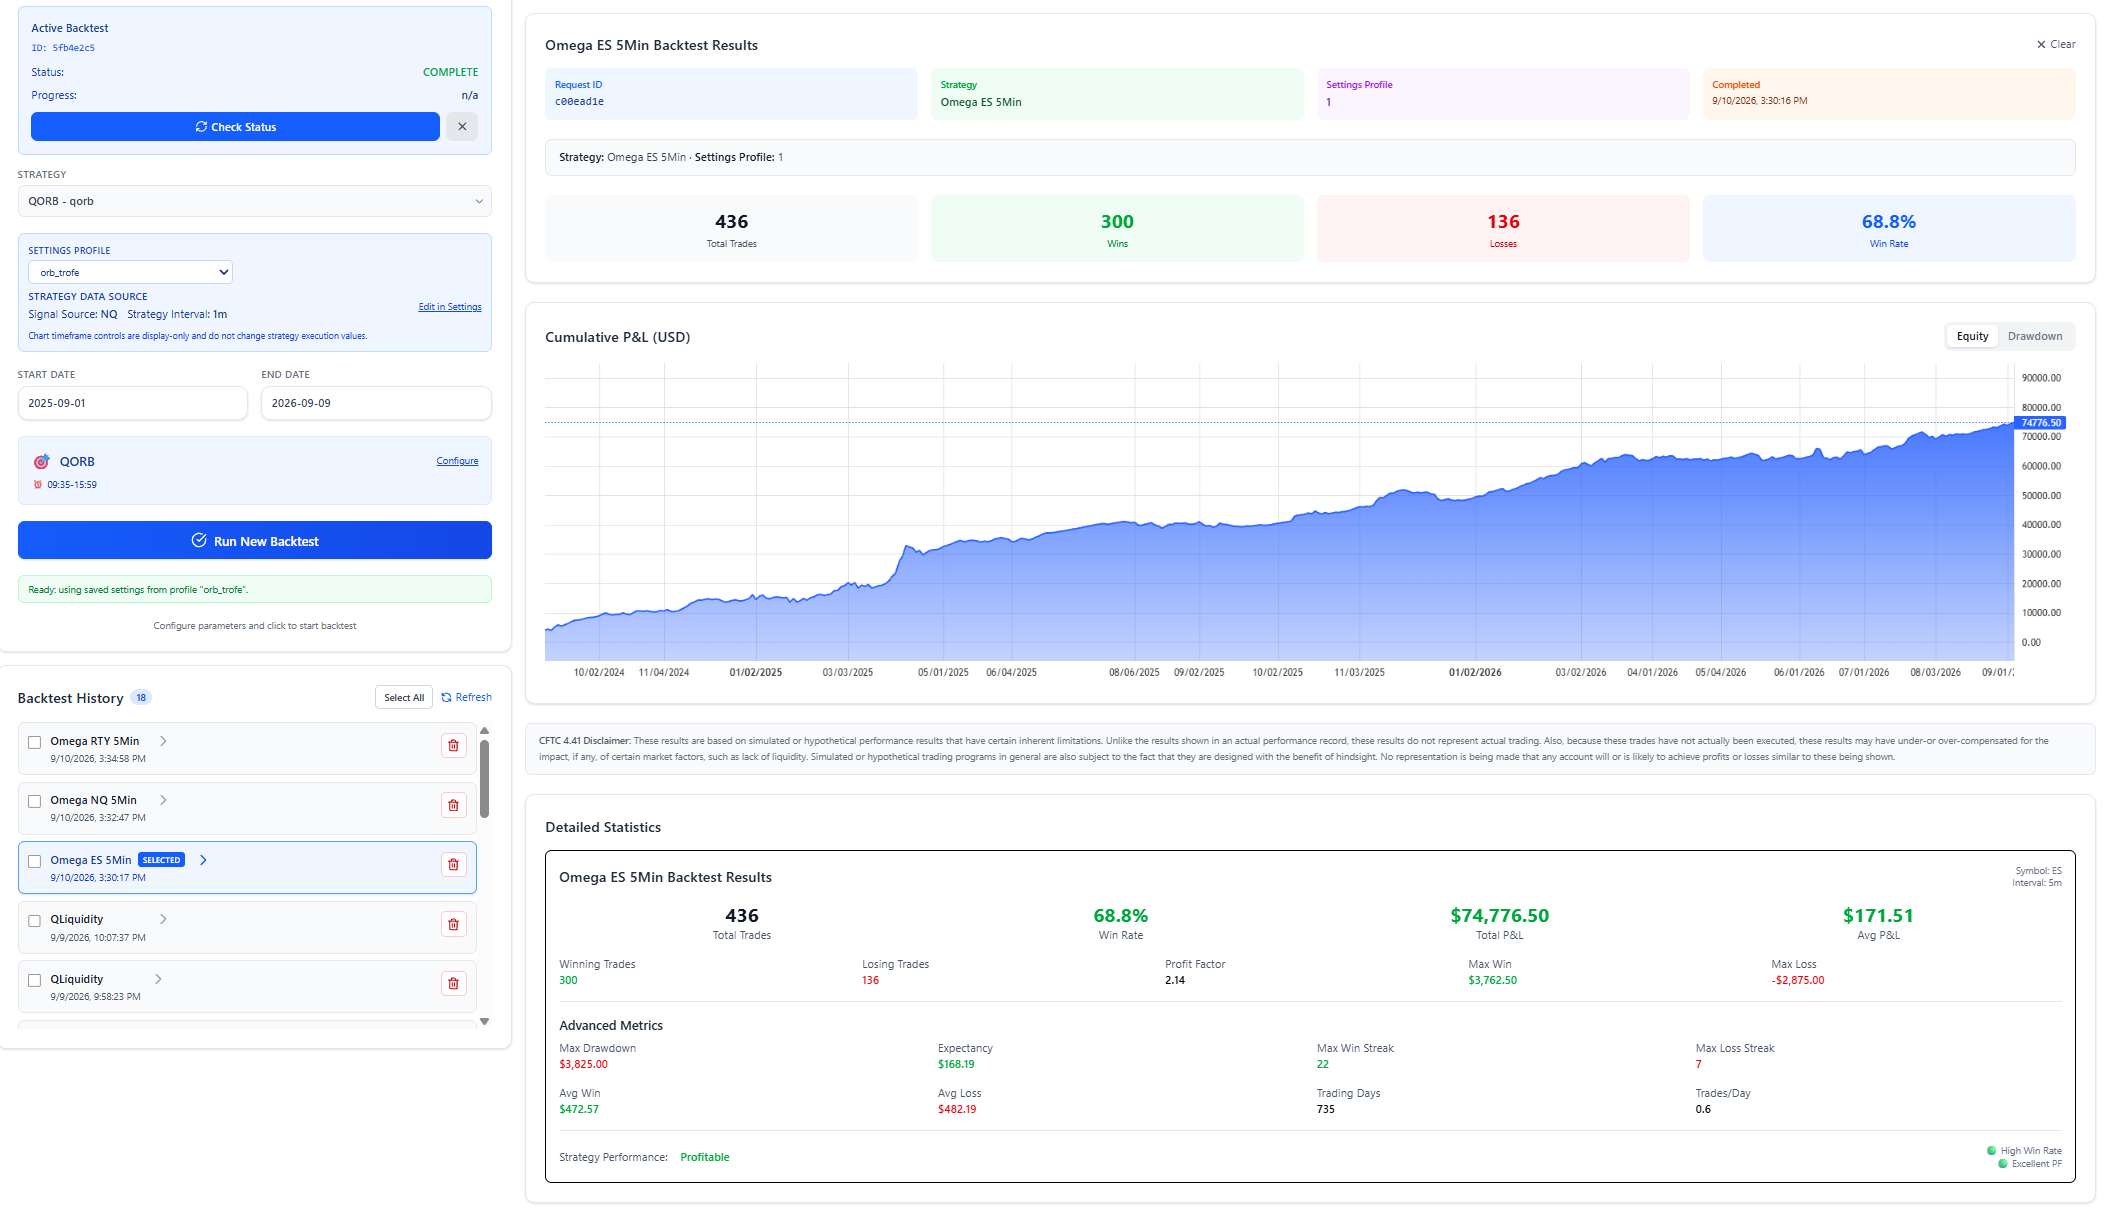
Validate strategies before risking any capital
The ATS includes our proprietary backtesting engine. Pick a strategy, load a settings profile, and replay it against years of market data — trade counts, win rates, equity and drawdown curves in seconds. No spreadsheets, no code, no taking our word for it.
PAST PERFORMANCE IS NOT NECESSARILY INDICATIVE OF FUTURE RESULTS.


Collaborate with thousands of other investors
20,000+ traders in the QuantVue Discord, with the team in the room every single day.

Inside the community
From signal to broker in one motion — trade copier & alert connector
QuantLynk connects the desk to your broker for automated execution, and the platforms you already use stay connected.
The execution layer of the ATS
QuantLynk carries every signal from the desk to your broker — simultaneously, across every account you run.
Every connected account fires at the same instant. No lead account, no followers trailing behind, no copier lag eating your fills.
Copy and group trade across prop firm and live brokerage accounts at once — one signal, every account, done.
TradingView, Tradovate, NinjaTrader, Rithmic, and TopstepX prop firms. Any alert becomes an executed trade.
Cloud infrastructure engineered for over a million trade requests at a time, with 99.99% uptime.
Unlimited alerts, tickers, accounts, and trades. Plus the LightningLynk dashboard: flatten, OCOs, and DOM orders across every account from one screen.
QuantLynk is the execution layer of the desk — the bridge that carries every signal to your broker. ATS members get it built in.


Us vs. them
Real clients, in their own words
Sit-down interviews with QuantVue clients on how they trade with the system. Individual results vary.
Ready to give your portfolio an all-weather edge?
Book your demo call or buy now — be running in about an hour.