

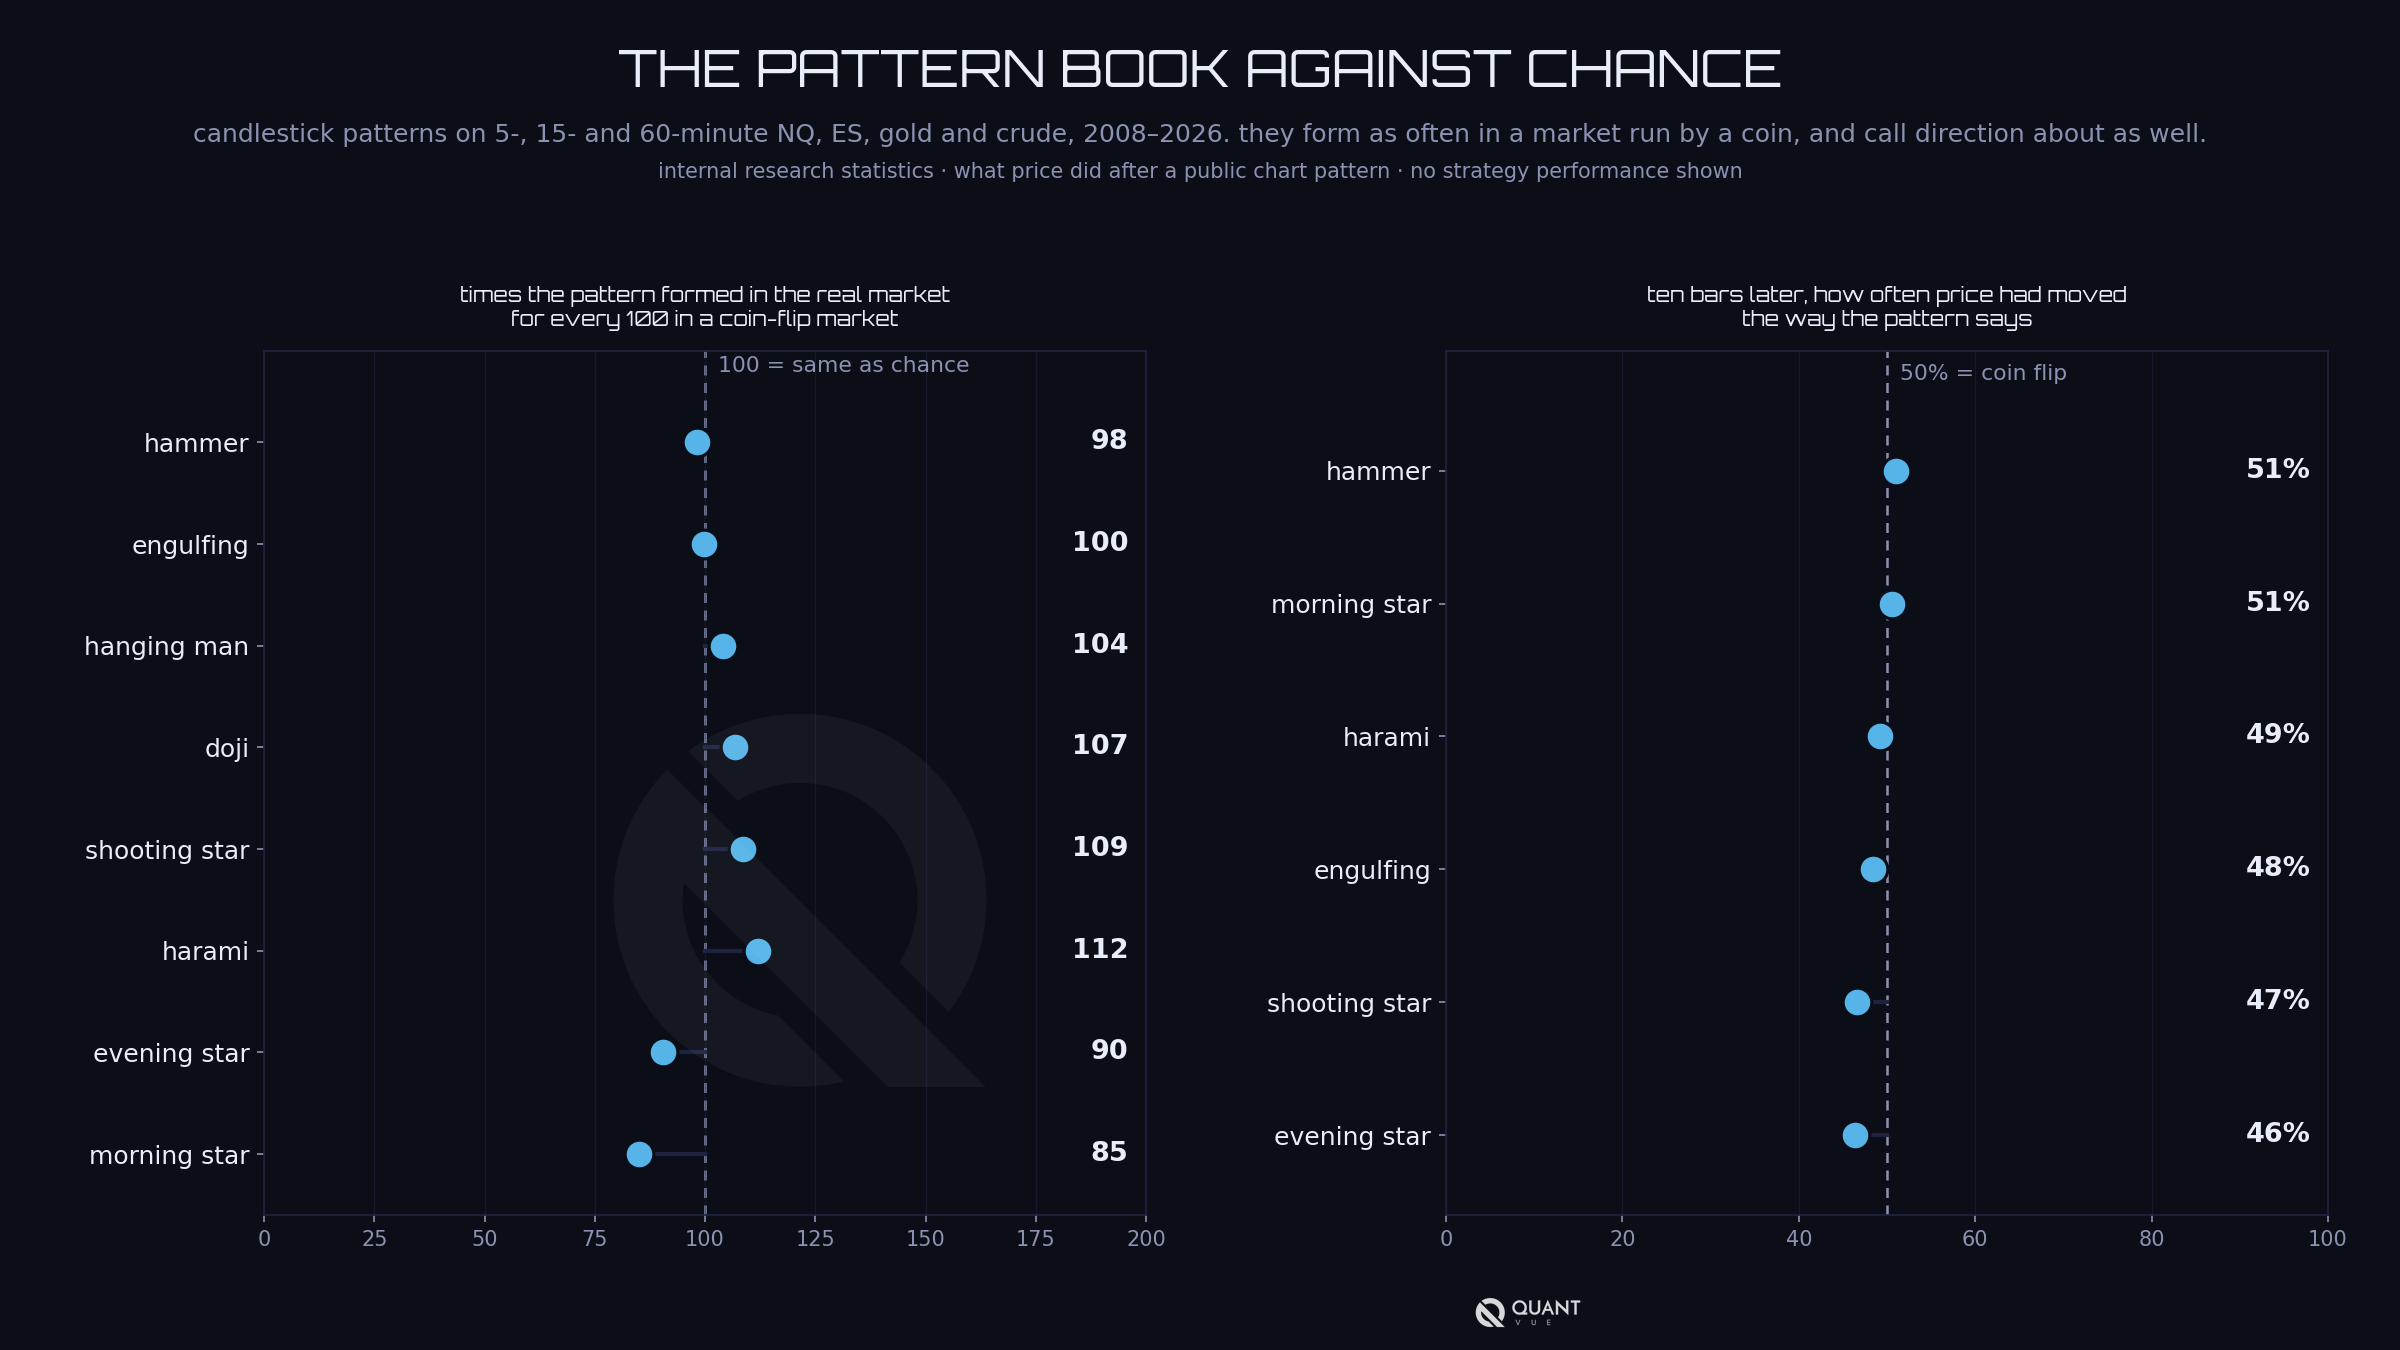
Candlestick patterns are the first thing most traders learn. Hammer, shooting star, engulfing, morning star, doji. I remember I had a big old book of them when I started. They were featured in the technical analysis manuals. I spent a ton of time on them back in 2011 when I started.
Each one has a name, a picture and a story about the fight inside the bar. The story ends with a prediction, so people write code that buys the hammer and sells the shooting star. Or whatever. People seem to make things up too. "Oh look it's the Flying Trash Over Ireland! That's bullish!!"
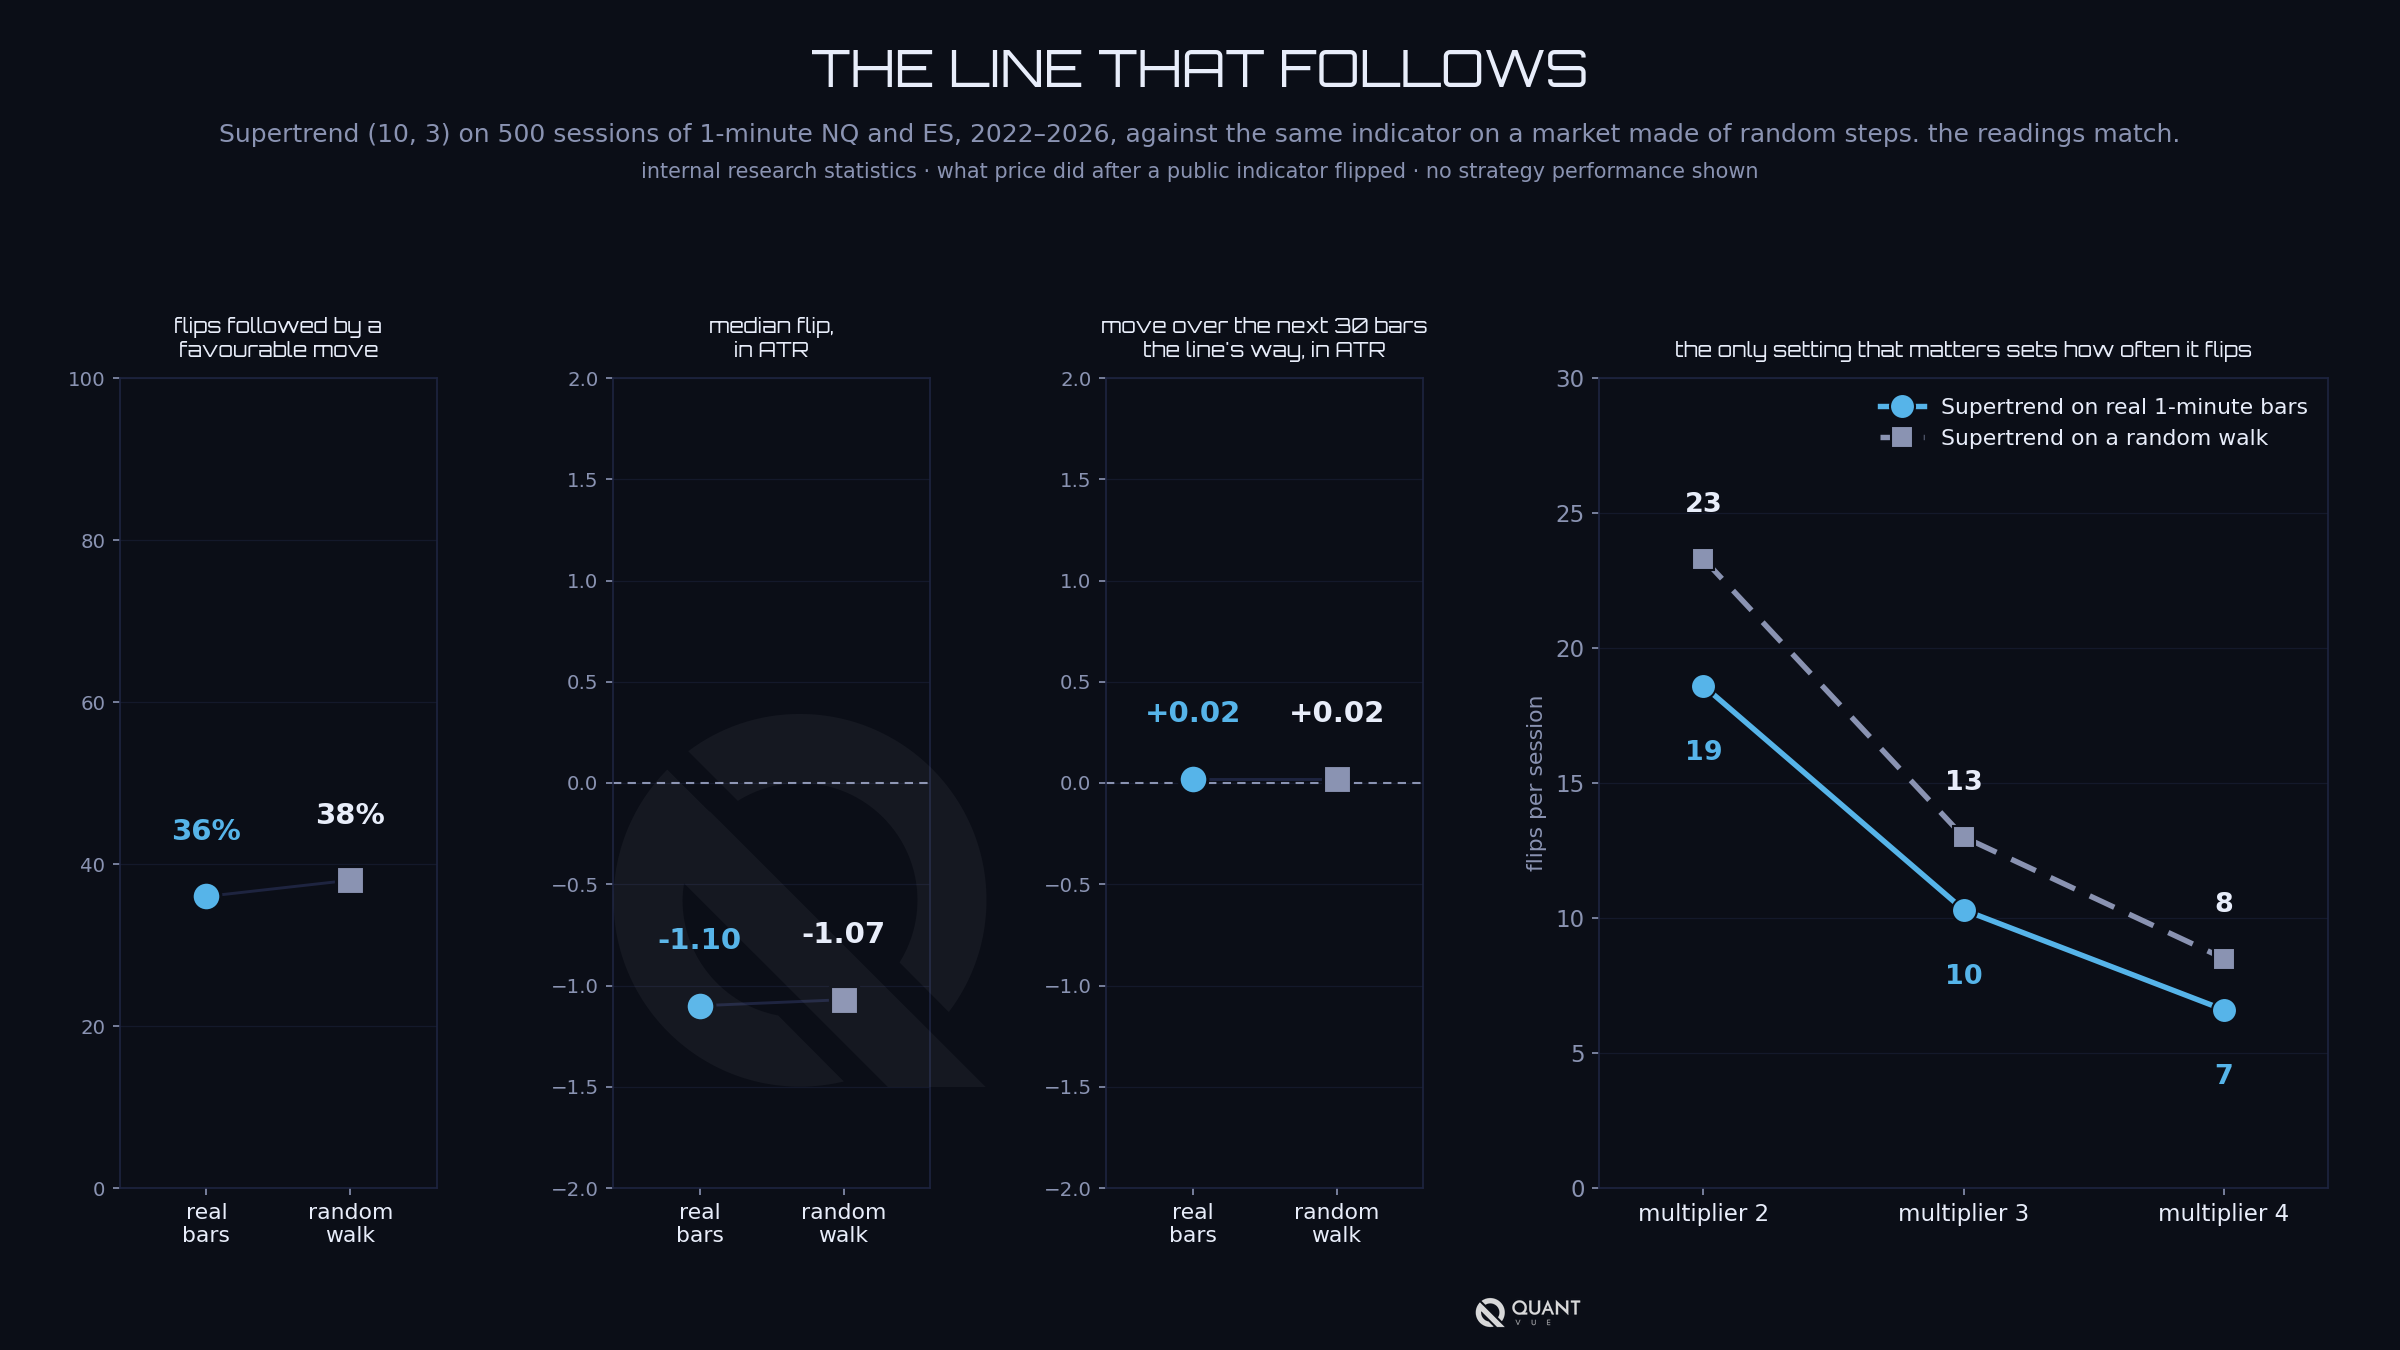
Let's look at what a candle actually is. It's four numbers from the past, the open, high, low and close in a particular and subjective time period. A pattern is a rule about the shape of one to five of those bars. Like the Supertrend line in #38, it is built entirely from the past. A record of the past can still carry information, so I tested it.
I took the 61 patterns in TA-Lib, a widely used open-source library, at default settings. I ran them on NQ, ES, gold and crude, on 5-minute, 15-minute, 60-minute and daily bars, with history back to 2008 for the index futures. That's more than three million pattern signals on the intraday bars alone. Entry is the open of the next bar. Then I measured the move 1, 3, 5 and 10 bars later in the direction the pattern claims, in ATR.
Each pattern faced two controls. The first is the one from #34, matched random bars. Same market, same time of day, same volatility, same recent trend, no pattern. This controls for normal movement at that time of day. The second is a fake market. I took every real one-minute bar and flipped a coin. Heads it stays as it was, tails it gets mirrored upside down. The bar sizes are real, the busy open and the quiet lunch are real, and the direction of every bar is decided by a coin. I built 1,000 of those per market. Anything a pattern finds in there is luck by construction.
The first result is that the patterns are all in the fake markets too, and about as often. For every 100 hammers in a coin-flip market, the real market printed 98. Engulfing patterns, 100 for 100. Doji 107, shooting star 109. A hammer is supposed to be buyers stepping in at the low, or whatever. It forms at the same rate in a market where nobody is stepping in anywhere.
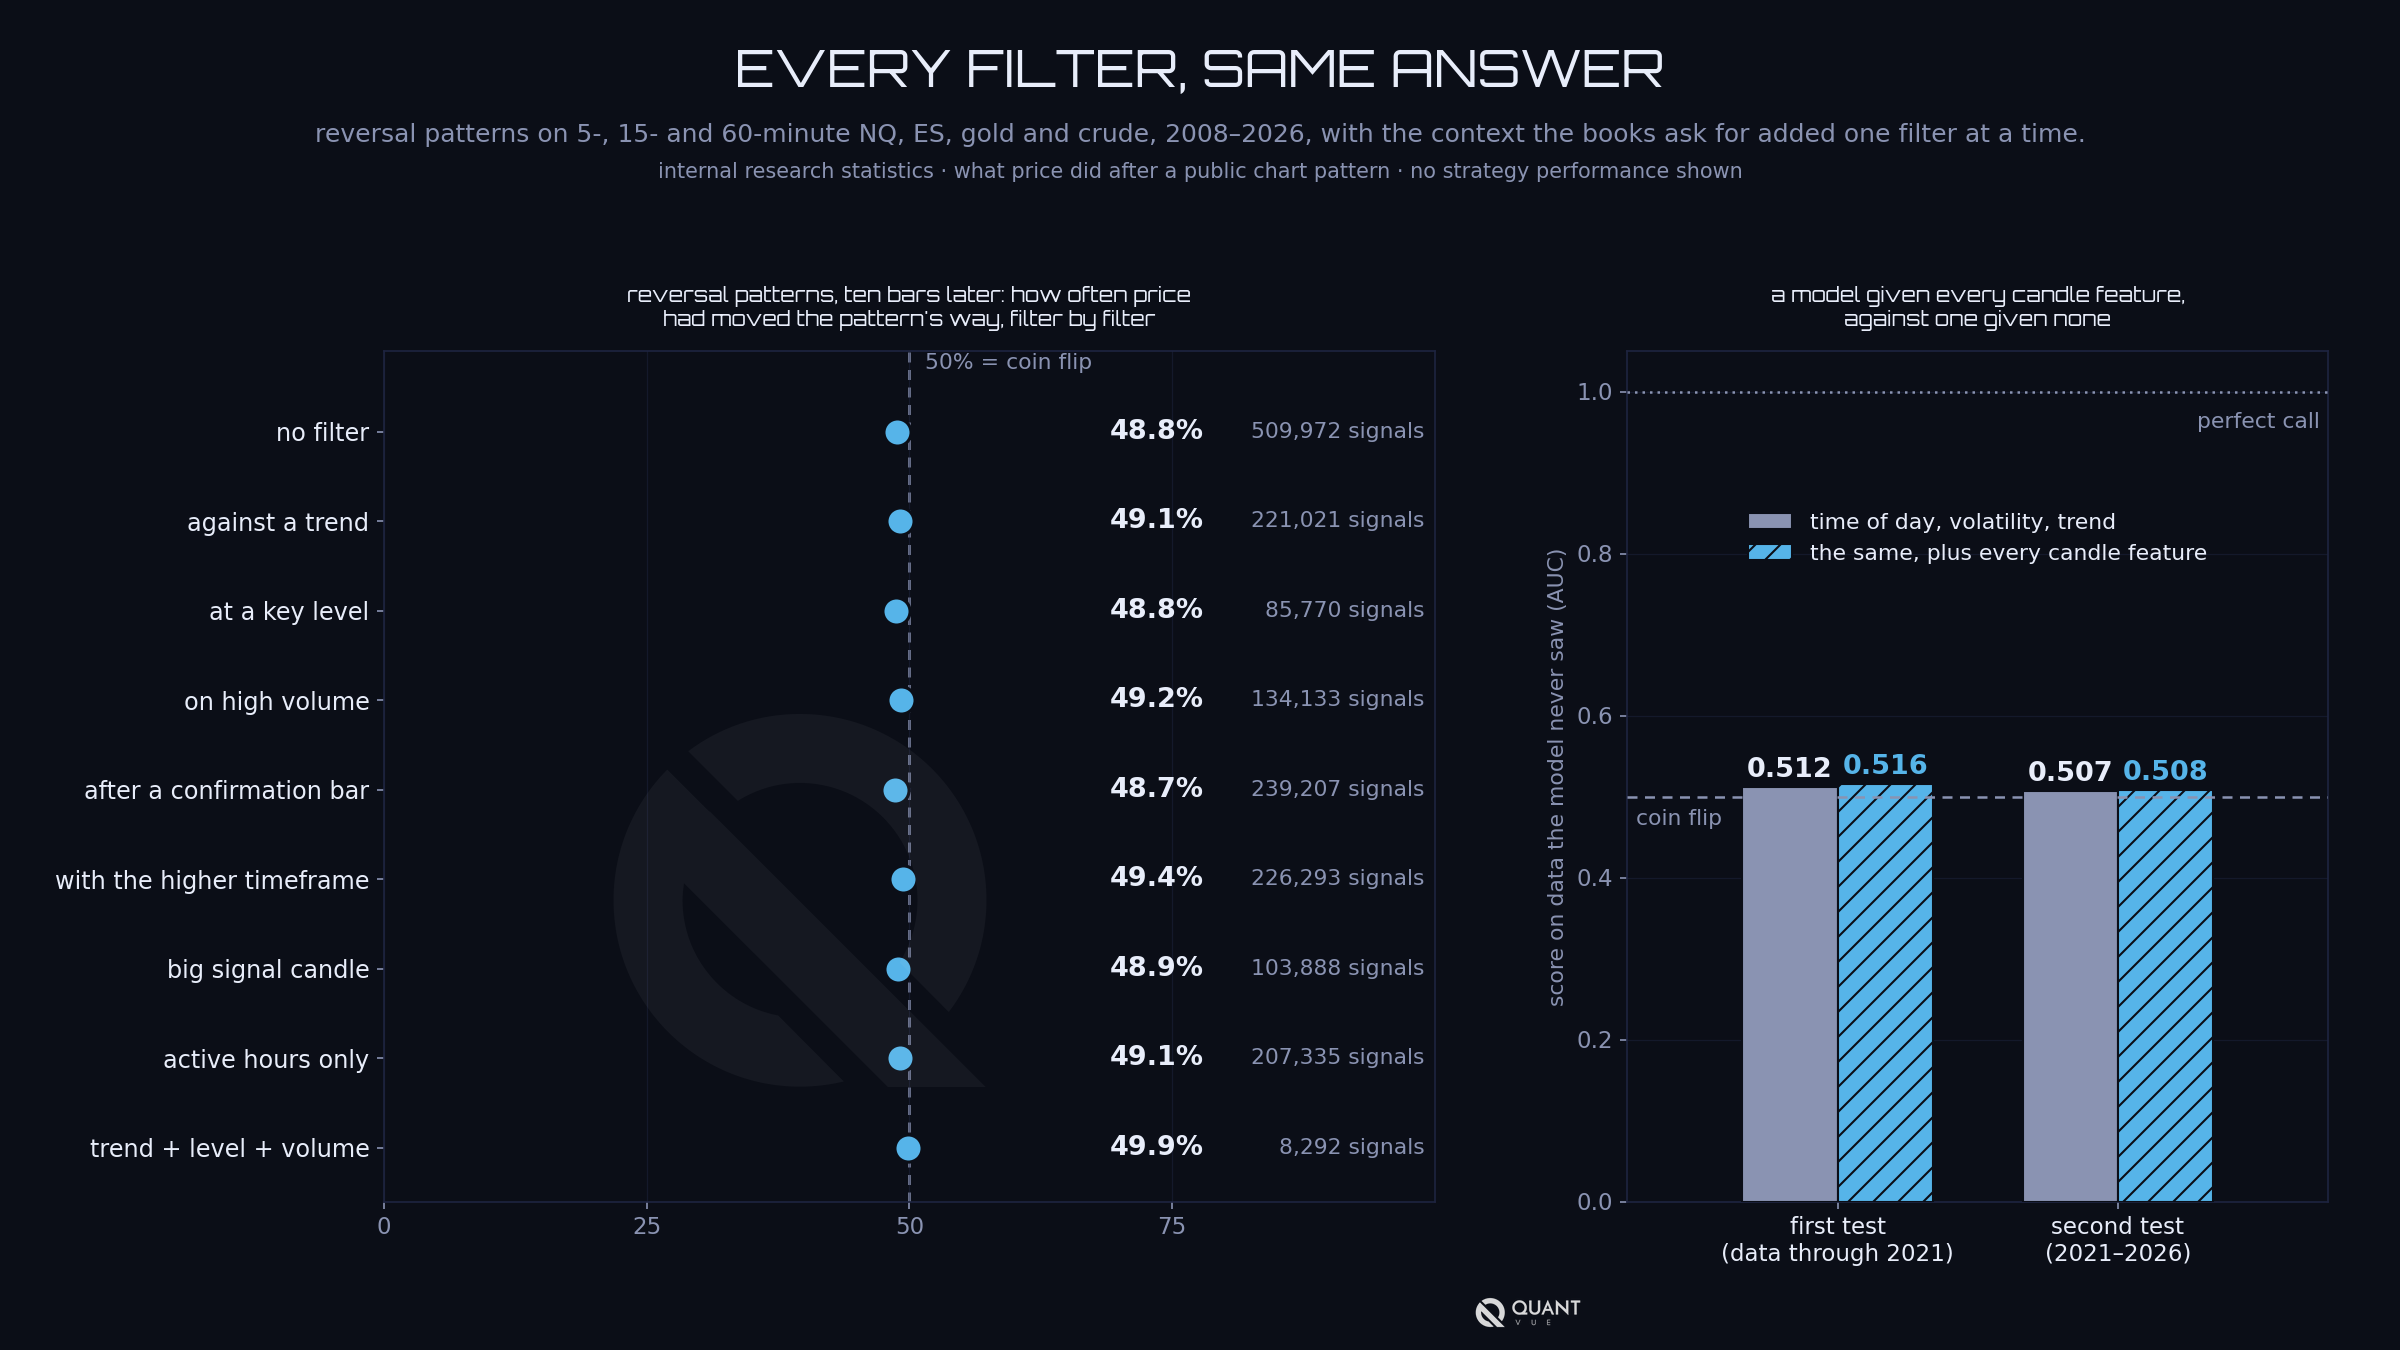
Then direction. Ten bars after a hammer, price was higher 51 percent of the time. Ten bars after a shooting star, it was lower 47 percent of the time. Engulfing 48, morning star 51, evening star 46, harami 49. Beside matched random bars, the average move after each of them was within about 0.05 ATR of zero.
To count as real, a pattern had to pass five checks:
1. Beat matched random bars after correcting for how many patterns I tried, which is #4.
2. Beat the best pattern the coin-flip markets could produce.
3. Repeat good results on later data OOS.
4. Clear trading costs and friction (e.g. slippage and commissions).
5. Show up in more than one market or bar size so it's not just an artifact of a particular setting.
None of the 61 passed.
Fourteen never got a test at all because they were too rare, three white soldiers and three black crows among them. Those are untested, which is different from failed. And the best pattern in the real market was nothing special. One coin-flip market in seven produced a best pattern that scored higher.
So why do they look so good on a chart? #29 covered it. You look at the low of the day, find a hammer there and remember it. With dozens of patterns to choose from, some pattern sits at almost every turn. The same patterns sit at all the places price didn't turn, and nobody screenshots those. The usual answer to all of this is that nobody trades a bare hammer and you need context. I tested that too, and it's the next lesson.
The next couple articles will get into such fun things as "But it was headed my direction with the Giant Bearish Engulfing Candle of the Loch Ness Monster!"
Trade well and ignore market patterns that fail to reject the null.
This lesson was originally sent to the Algo Creator School email list on November 16, 2026. New lessons go out by email regularly. Join the list at quantvue.io.
Educational content only, not financial advice. Futures trading involves substantial risk of loss and is not suitable for all investors. Individual results vary, and past performance, actual or simulated, does not guarantee future results.


After check out, you will receive a Welcome Email with your login details.
Use these details to Login to our dashboard, where you'll then submit your TradingView or NinjaTrader information.
Access is granted automatically if the form is filled out properly.
If you are having issues with access being granted, please submit a support ticket here.
No. Our core system is designed for those with baseline trading knowledge and live-trading experience. Do not sign up if you're a beginner trader. Intermediate to advanced experience is recommended.
No. There is no algorithm or indicator that can accurately predict with 100% certainty the financial markets.
QuantVue is not responsible for trading losses. Past results are never indicative of future performance. Use QuantVue and trade at your own risk.
Our tools are designed for futures. However, clients can tweak our toolkit to any chart or market.
Most clients use a paid TradingView plan, and the most popular among users is TradingView premium.
You can manage your account in the "My Account" tab or submit a support ticket here and we will process your cancellation immediately!
Our monthly & yearly Pro / Elite plans are backed by a 30-day money back guarantee. If you are not 100% satisfied within 30 days from the time of purchase, you may request a full refund.
Beyond the 30-day period, all sales are final.
The 30 day money back guarantee only applies to first time customers. If you have used our system or had a plan in the past, you are not eligble for a refund. This means if you have used the PRO plan in the past and sign up for ELITE at a later date, you will not be elgible for the refund guarantee and vice versa.
This refund policy does not apply to our ATS program.
See our full refund policy here.
There is a separate money back guarantee for the ATS Program. The ATS refund policy has certain conditions that must be met to receive a full refund.
See our full ATS refund policy here.
The Elite Plan on it's own does not automate into cash or prop firm accounts.
If you want to automate our tools into cash or prop accounts, you can do so via our alert connector QuantLynk here.
Keep in mind QuantLynk is detectable by prop firms, so we recommend using an automation-friendly prop firm.
To automate our tools into prop account undetected, we recommend our ATS Program here.
No. There is no free trial on the ATS program.